Market Moves
Interest Rate Outlook – “Old Normal”
Jerry Paul, CFA
January 23, 2014
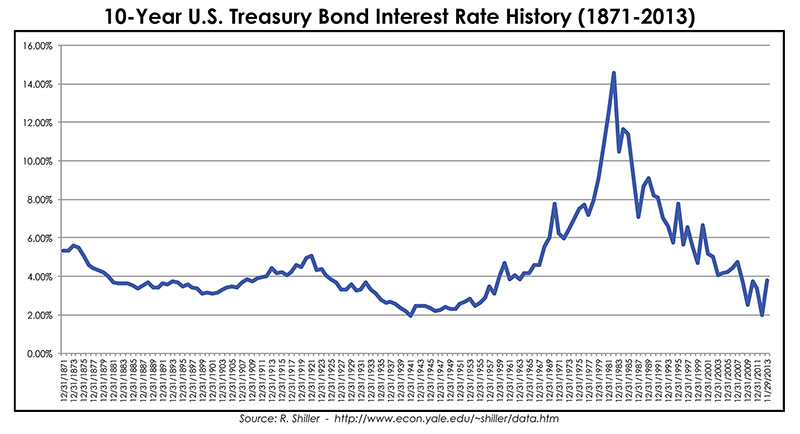
Contrary to a popular belief that interest rates are destined to rise significantly, at ICON we believe we may be re-entering the “old normal” where the U.S. Treasury 10-year yield remains between 2%-4% for an extended period of time. As can be seen in the following chart of interest rates since 1871, with a few exceptions this is where interest rates traded prior to the mid-1960s. From this perspective, the late 1970s appear to be unusual and the decline of the last 32 years is simply a return to normal, where rates may remain for many years in a setting of slower growth and low inflation.
In a March 1, 2013 speech Fed Chairman Bernanke spoke on long term rates. Quoting the Chairman, “The fact that market yields currently incorporate an expectation of very low short-term real interest rates1 over the next 10 years suggests that market participants anticipate persistently slow growth and, consequently, low real returns to investment. In other words, the low level of expected real short rates may reflect not only investor expectations for a slow cyclical recovery but also some downgrading of longer-term growth prospects.”
ICON’s “Old Normal” Interest Rate Math:
Well known to those who follow economic policy, the Federal Reserve has a stated target of 2% nominal inflation, which we believe is easily obtainable under these economic conditions. According to the latest Bureau of Labor Statistics report, 12-month trailing inflation before seasonal adjustment increased 1.1% for the month ending November 30, 2013 as measured by the Consumer Price Index for All Urban Consumers (CPI-U). Less well known is that as of February 28, 2014 Treasury Inflation Priced Securities (TIPS) are pricing in 1.75% inflation over the next 5 years and 2.10% inflation over the next 10 years.
Our research and several academic studies suggest a real (in addition to inflation) return of 2% on intermediate government bonds is appropriate. As Chairman Bernanke noted in March of 2013, we have recently been below that 2% real return rate and may stay lower for some time. Even with low estimates of inflation hovering around 1% plus real returns around 1% we get a target U.S. Treasury 10-year yield of 2% on the lower-end. On the high end of estimates, there would be 2% inflation plus 2% real returns and we get a general U.S. Treasury yield target ceiling of 4% with some room for lower yields. All in all, this gives us a final outlook of 2%-4% rates for the U.S. Treasury 10-Year yield for the foreseeable future.
 We contend that many investors are misjudging the magnitude of future interest rate levels. We believe this may be related to behavioral biases such as ‘groupthink,’ anchoring from previous forecasts and belief perseverance. A majority of today’s investors have lived through an environment of historically high interest rates and are aware of the high inflation rates of the late 1970s and early 1980s. These historical biases may be driving investors’ views about future interest rates, while the economic backdrop is pointing towards a return to the “old normal” we mentioned above.
Weak Growth and Inflation:
At ICON we believe interest rates are primarily driven by inflation expectations, which in turn are generally related to economic activity, particularly heightened growth environments. Our view is that economic growth over the next 3-5 years will generally be in 1%-3% annual growth range, much lower than historically, and not enough to result in a significant change in inflation expectations.
Despite the Federal Reserve’s aggressive stimulus for the past five years, we are not experiencing above normal inflation, which at 1.1% is currently running below the five-year average of 2.0%. GDP growth has remained anemic, although some improvement has occurred in the past couple years, yet it is still not at historic levels.
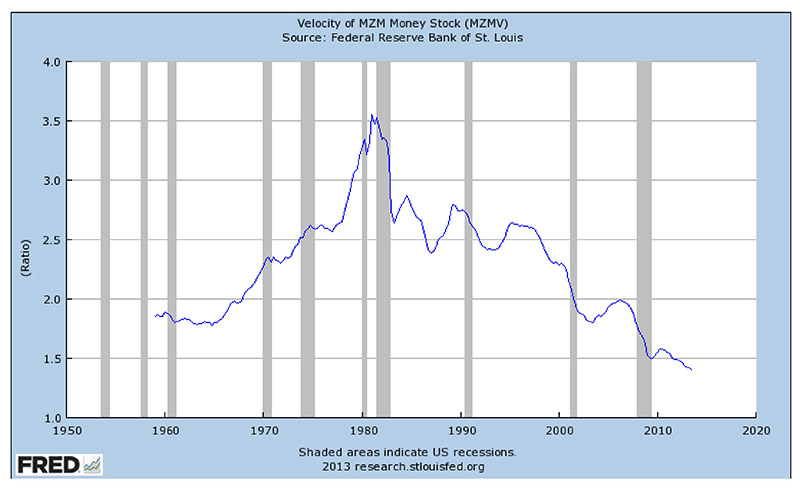
The chart below on money velocity (the number of times that the money supply turns over in a year,) provides further support that inflation is not likely to break out. The velocity of MZM is used by the Federal Reserve and economists as one indicator of future inflation. As you can see, velocity has never been lower suggesting no near term risk of inflation. It also suggests economic activity remains low to moderate at best.
Monetarist Inflation Concerns:
We would like to address the concerns of monetarists regarding the Federal Reserve Quantitative Easing programs. Some monetarists believe the programs themselves lead to a heightened risk of excessive money supply, which could potentially lead to inflation. Let’s review some of the information.
The following chart of bank excess reserves shows that despite the Federal Reserve’s efforts, money supply is locked within the banking system and not entering the real economy. Accordingly, the inflation predicted by monetarists has not occurred.
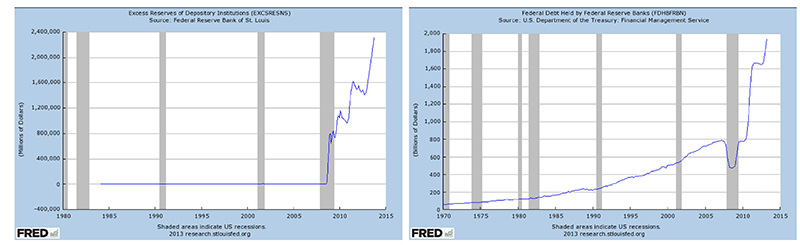
These charts demonstrate that most of the reserve creation has financed the U.S. Treasury and not resulted in bank lending.
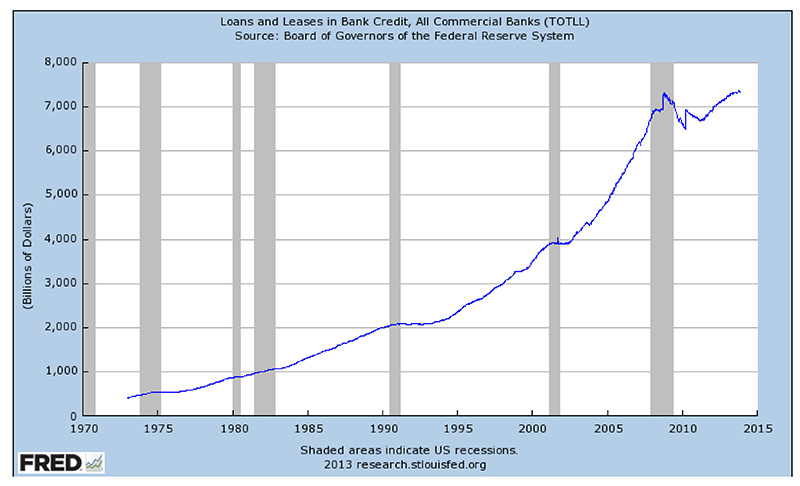
This final chart further demonstrates bank lending has not grown meaningfully since the beginning of the so-called Great Recession. This further suggests that the “money creation” concerns of the monetarists have not occurred and hence their associated inflation concerns have not been realized.
At some future point the reserve money may make its way into the system, however, we doubt this will happen anytime soon. For the time being we conclude that the current monetary policy is not inflationary.
In conclusion we believe:
- Short term rates will remain low into 2017 or 2018 and maybe longer
- GDP growth will fluctuate around 2% +/- 1% for the next 5 years
- Inflation will generally remain at 2% or lower for the next 5+ years
- Real returns on U.S. Treasury 10-year yield will average 1%-2%
- The U.S. Treasury 10-Year Note yield will likely fluctuate between 2%-4% for the foreseeable future

Jerry Paul, CFA, Senior Vice President of Fixed Income – Portfolio Manager of the ICON Flexible Bond Fund and Co-Portfolio Manager of the ICON Equity Income Fund.
The data quoted represents past performance, which is no guarantee of future results. Investment return and principal value will fluctuate and shares, when redeemed, may be worth more or less than their original cost. Current performance may be higher or lower than the data quoted. Please call 1-800-828-4881 or visit www.InvestwithICON.com for performance results current to the most recent month-end. Returns assume the reinvestment of dividends and capital gain distributions and reflect applicable fees and expenses.
Past performance does not guarantee future results. There are risks involved with mutual fund investing, including the risk of loss of principal. There is no assurance that the investment process will consistently lead to successful results. An investment concentrated in sectors and industries may involve greater risk and volatility than a more diversified investment. There are risks associated with small- and mid-cap investing such as less liquidity, limited product lines, and small market share. An actively managed investment product does not guarantee better returns or performance than any other kind of investment.
Opinions and forecasts regarding sectors, industries, companies, countries and/or themes, and portfolio composition and holdings, are all subject to change at any time, based on market and other conditions, and should not be construed as a recommendation of any specific security, industry, or sector.
1Real Interest rate is an interest rate that has been adjusted to remove the effects of inflation to reflect the real cost of funds to the borrower, and the real yield to the lender. The real interest rate of an investment is calculated as the amount by which the nominal interest rate is higher than the inflation rate. Real Interest Rate = Nominal Interest Rate – Inflation (Expected or Actual)
Term premium is the amount by which the yield-to-maturity of a long-term bond exceeds that of a short-term bond. Because one collects coupons on a long-term bond for a longer period of time, its yield-to-maturity will be more. The amount of a term premium depends on the interest rates of the individual bonds.
Gross Domestic Product (GDP) is the total value of goods and services produced in the national economy in a given year. It is the primary indicator of economic growth.
10-year Treasury notes are debt obligations issued by the U.S. Treasury that have a term of more than one year but not more than 10 years. The 10-year yield is the benchmark 10-year yield to maturity reflected by the current issue 10 year U.S. Treasury note.
The Consumer Price Index (CPI) is the primary indicator of U.S. inflation and is used to make cost-of-living adjustments to billions of dollars in benefit payments. Individuals cannot invest directly in an index.
M1 is one measure of the money supply that includes all coins, currency held by the public, traveler’s checks, checking account balances, NOW accounts, automatic transfer service accounts, and balances in credit unions.
Consider the investment objectives, risks, charges, expenses, and share classes of each ICON Fund carefully before investing. The prospectus and the statement of additional information contain this and other information about the Funds and are available by visiting www.ICONAdvisers.com or calling 1-800-828-4881. Please read the prospectus and the statement of additional information carefully before investing.
RFS Partners, Distributor
