The Federal Reserve & Money Supply
Dr. Craig Callahan, DBA – ICON Founder & President
March 10, 2015
The Federal Reserve (FED) was formed in 1913 by Congress as an independent government agency, with the intention that it would be free from political pressures. Think of it as a club that banks can join – mandatory for a federally charted bank, optional for a state chartered bank. Monetary policy of the FED has two objectives; full employment and price stability. To try to attain these two objectives; the FED influences the money supply (M1), taking actions that aim to either speed up or slow down M1 growth. In its simplest form, M1 is defined as currency plus demand deposits (checking accounts). To influence the size of the money supply, the FED either injects reserves into the banking system or withdraws reserves from the system. Reserves on a bank’s balance sheet are defined to be currency plus deposits at the FED. Reserves matter because banks are restricted to a certain ratio of loans-to-reserves. To illustrate, let’s say the ratio banks are restricted to is 10-to-1. If a bank has $1 in reserves, it can have $10 in loans outstanding. If the FED injects (gives) the bank $1 more in reserves, the bank now has $2 in reserves and can make $10 in new loans, taking total loans up to $20 ($2 x 10). Notice in this simple example, M1 just grew by $10, because the bank makes a loan by putting money into a demand deposit so the borrower can write a check. As demand deposits are part of M1, money was created and the money supply just grew.
When acting to speed up the growth of the money supply, the FED injects reserves, banks make loans and M1 grows. When acting to slow the growth of the money supply, the FED withdraws reserves, banks loan less and M1 growth slows. Banks create money by making loans, acting in their own best interest to make profits from lending. Notice increasing M1 is not political, neither republican nor democrat. It is not directed at some social, geographic or economic target. It is just money.
How is M1 related to economic activity? Monetarists have an equation to relate M1 to economic activity. MV=PQ. M is the money supply. V is velocity, or the number of times that a dollar turns over. So, one way of describing total spending is the amount of dollars times the number of times they turn over (are exchanged). The right side of the equation also describes total spending, where Q is the quantity of goods and services that are transacted and P is their price.
Monetary Policy Pre & Post Recession
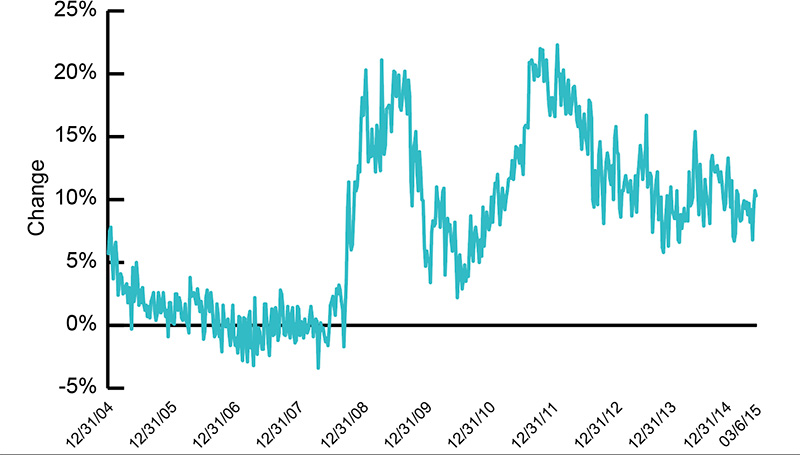
Here is a graph of the year-over-year (52 week) rate of change in M1 back to 1/1/2005. Entering 2005, M1 had been growing around 5% over the previous year, right near its historic average. Over the next couple of years the price of oil and many other commodities rose and real GDP hit a healthy 5% pace in some quarters. In what appeared to be a proactive move to fight potential inflation, the FED drained reserves and slowed the rate of growth of M1 to zero. In 2007, however, with news of sub-prime mortgage problems, the FED lowered the discount rate attempting to avoid a bad recession.
Generally, lowering the discount rate encourages banks to borrow reserves from the FED and thereby enables them to make more loans and grow the money supply. Unfortunately, the FED did not realize that the banking system was frozen due to bad loans and CDOs and could not make loans. It took about a year during late 2007 and 2008 and some extremely unusual moves by the FED and the Treasury Department to unlock the system so banks could lend. Finally, by early 2009, banks were lending and M1 grew at a 20% year-over-year pace. With its normal lag of a few months, the economy began recovering.
After giving the recovery the initial jolt of 20% year-over-year growth of M1, the FED slowed M1 growth back near 5%. The broad economy, however, had not gained enough momentum and the recovery slowed. In November of 2010, in a move dubbed QE2, the FED injected reserves, and M1 growth once again reached the 20% range. Since early 2012, growth of M1 gradually dropped, generally staying in the 10% range, and falling even lower lately with the ending of the FED’s bond buying program.
M1 Rolling 52-Week Percentage Change
The data quoted represents past performance, which is no guarantee of future results.
We find the FED’s behavior over the last six years to be sensible, necessary and proper. Often times a combination of monetary and fiscal stimulus is used to jolt the economy out of recession. However, after 2008, the public and congress had no appetite for Government borrowing and spending so the FED had to “go it alone.” In fact, in 2013 the FED even had to overcome an automatic tax increase and spending reduction, a fiscal combination that would normally be recessionary.
Bolstering our belief that the FED’s acted sensibly over the last six years are the actions of the European Central Bank. The European Central Bank, whose primary objective is price stability, stimulated in 2009 but soon slowed its M1 growth to only 1%, worrying about inflation. Most European countries went back into negative GDP territory, which appears to be the price they paid for the European Central Bank not providing as much stimulus as the FED.
We hear criticism of the FED. To us, however, many critics seem incapable of citing specific risks or harm from FED policy. They simply just don’t like something about it. Some critics cite potential inflation, but these critics have been wrong, as inflation has been very low. Further, looking forward, we don’t see conditions present that we believe would support increasing inflation. In other words, the FED has been free to pursue a necessary accommodative monetary policy without risking higher inflation.
What is different after 2008 & 2009?
Let’s go back to MV = PQ. Since the recession, velocity has slowed. To illustrate this we will use an overly simplified example. Normally, a waiter gets a tip, and then buys shoes. The shoe salesperson buys a dress, the dress sales person buys a golf club and so on. However, since 2009, we believe the chain stops sooner as one person saves or pays off debt. It is important to note that the FED can’t control velocity. We have needed more M (money supply) to make up for the slower V (velocity). On the right, P (price) hasn’t risen because there is no shortage of Q (quantity of goods and services). The system isn’t feeling any capacity constraint. We can make more of just about anything. Want more software or hardware? No problem. More housing, automobiles, even oil? No problem either. Four years ago at a conference, I made the case that inflation would not increase. Most in the audience disagreed. One member stated something he had memorized in college, “too many dollars chasing too few goods.” The problem with his argument is that there is not “too few goods” or services. We can always make more of almost anything we want. We have had a very docile and forgiving environment for the monetary stimulus provided by the FED.
Who’s Money?
Until this recovery, the FED did not pay interest on reserves that banks deposited with it. The FED could invest those deposits and earn interest, but didn’t pay interest to the banks. Each year, it paid a dividend back to member banks, built up capital surplus and paid remaining profits to the Federal Government. Since the financial crises, the FED has been paying interest on reserves, but it is minimal. The FED has been buying longer term bonds and earning the interest on those, a healthy profit spread above the minimal interest paid on reserves. This means that the FED is not using your money, my money or the government’s money. The FED is a bank, it has its own money.
FED and the Stock Market
There is a popular view held by many investors and some in the media that the FED lowers interest rates to stimulate the economy and raises rates to slow down the economy. At ICON, we disagree and believe it is the rate of growth of M1 that stimulates or slows the economy. From our perspective it is possible for short term interest rates to be rising, but M1 still growing at a pace to support economic growth, which is what we expect over at least the next couple of years. We expect the FED to gradually withdraw reserves, short term interest rates will rise and M1 growth will slow to the historic average near 5% – very adequate to support continued economic growth when the economy has momentum. We have seen some commentary suggesting investors should sell stocks when short term interest rates begin to rise, fearing rising rates will slow the economy. In our view however, as long as M1 is growing, economic growth can continue.
Perhaps a look behind the scenes can explain the interest rate focus. To ease, the FED buys T-Bills from a bank and pays for them by increasing the size of the bank’s deposit at the FED (reserves). By buying T-Bills the FED puts downward pressure on the interest rate but the important impact of its action is that reserves have increased, the bank can make more loans and M1 increases. It is the increase in M1 that stimulates the economy, the drop in interest rates is just a byproduct of the FED’s action.
Over the last five and a half years, we believe there are investors who have missed out on the impressive stock market returns because of not understanding and/or not trusting the Federal Reserve. We see investors selling equities lately for the same reasons. Over the many decades I have studied and participated in the stock market, there has always been a group of investors who criticize the FED and continually expect that the FED will take incorrect actions. At ICON, we ignore them and focus on value. Our valuation readings coupled with the absence of the conditions we believe are typical of market peaks, makes us think this bull market can continue.

Dr. Craig Callahan is the Founder and President of ICON, and is chairman of the ICON Investment Committee. He is also Portfolio Manager for the ICON Fund and the ICON Opportunites and Long/Short Funds and Co-Portfolio Manager of the ICON Risk-Managed Balance Fund.
Past performance does not guarantee future results.
Opinions and forecasts are subject to change at any time, based on market and other conditions, and should not be construed as a recommendation of any specific security, industry, or sector.
Investing in securities involves risks, including the risk that you can lose the value of your investment. There is no assurance that the investment process will consistently lead to successful results.
ICON’s value-based investing model is an analytical, quantitative approach to investing that employs various factors, including projected earnings growth estimates and bond yields, in an effort to determine whether securities are over- or underpriced relative to ICON’s estimates of their intrinsic value. ICON’s value approach involves forward-looking statements and assumptions based on judgments and projections that are neither predictive nor guarantees of future results. Value readings are contingent on several variables including, without limitation, earnings, growth estimates, interest rates and overall market conditions. Although valuation readings serve as guidelines for our investment decisions, we retain the discretion to buy and sell securities that fall beyond these guidelines as needed. Value investing involves risks and uncertainties and does not guarantee better performance or lower costs than other investment methodologies.
M1 is one measure of the money supply that includes all coins, currency held by the public, traveler’s checks, checking account balances, NOW accounts, automatic transfer service accounts, and balances in credit unions.
Please visit ICON online at www.iconadvisers.com or call 1-800-828-4881 for the most recent copy of ICON’s Form ADV, Part 2.
