FINALLY! A money manager classification system that sorts managers by their investment strategy.
Dr. Craig Callahan, DBA – ICON Founder & President
August 31, 2016
With some input and urging from me, and a lot of research on his own, Tom Howard Ph. D. of AthenaInvest developed a system to classify money managers by strategy. This system defines strategy as the manner in which an investor goes about analyzing, buying, and selling stocks. Ask almost any money manager how she goes about investing and she will proudly and easily go on for about a half an hour, if you let her, describing her investment approach. For mutual funds the manager’s strategy is stated in the prospectus in a very informative section called, what else, “strategy.” Dr. Howard’s expensive and patented algorithm scans the strategy section of the prospectus, seeking out “elements” a manager might use to implement her strategy. The system defines elements as evaluation criteria with standards that must be met in security selection. These elements may include, but certainly are not limited to, a P/E ratio, a future growth rate in earnings per share, or a return on equity criterion. Using the algorithm and prospectuses, all U.S. and International active equity mutual funds domiciled in the U.S. (about 7,800 – including all share classes) are classified into one of ten strategies listed below.

I think it is important to point out that, as strategies in the AthenaInvest system, valuation and future growth are defined a bit differently than they are in the characteristic or “style” grid, a square in which stocks are classified by size and some valuation measure. As defined by the AthenaInvest system, valuation managers like to buy companies that are cheap, with many different ways to determine value such as Price-to-Earnings, book value or sales, Benjamin Grahams’ Central Value Formula, the dividend discount model, or liquidation value to name a few.
Future Growth managers, according to the AthenaInvest system, seek growth but can go about it in a variety of ways. Some may focus on earnings per share growth. Others might emphasize revenue or overall company growth. Still other managers could emphasize sustainable growth or look for accelerating growth.
Strategy Performance
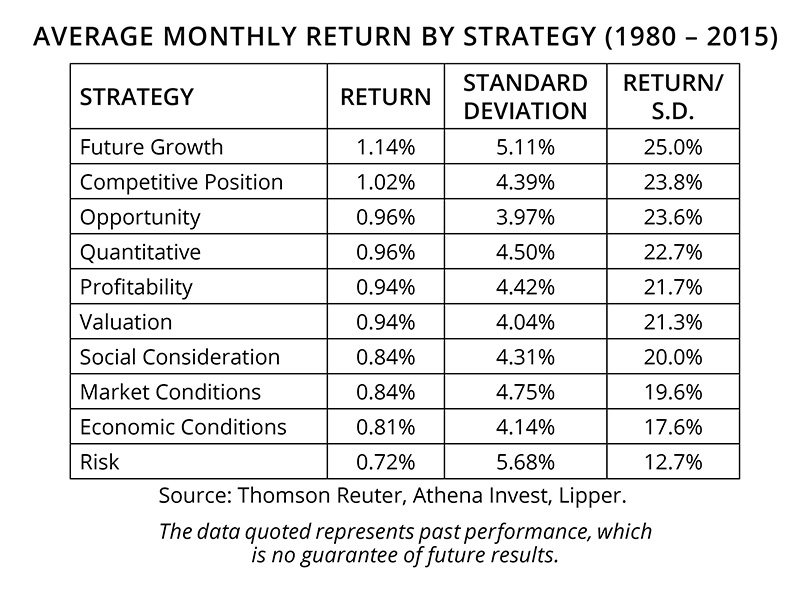
We believe that grouping mutual funds by strategy can yield useful peer groups for further analysis of strategy performance. The following table shows the average monthly performance of the ten strategies over the last thirty-four years as well as the standard deviation, and ranks the strategies by the return divided by the standard deviation of monthly returns. We believe the managers pursuing the better performing strategies may have found some factors that drive or generate returns over the long run. Conversely, we believe the lesser performing strategies use elements, or try to exploit factors, that may not generate or drive returns.
Opportunity and Competitive Position have been the best two performing strategies, in terms of return/risk, over the time period. Further, the bottom of the table consists of the same four strategies regardless of whether the strategies are sorted on pure return or return/risk: Economic Conditions, Social Considerations, Market Conditions and Risk. To us this could mean two things: either that those strategies are not good strategies, on average, or the managers using those strategies are not good at it. We suspect that if we could survey individuals who invest for themselves and place them in one of these strategy categories, we might find Economic Conditions and Market Conditions to be the two most popular strategies. Yet, based on the AthenaInvest research, and despite their intuitive appeal, those strategies do not appear to work well for professional money managers. Also of note is that the category containing managers whose stated strategy is to seek a reduction in risk have the highest standard deviation of returns.
While the above chart reveals some characteristics of the effectiveness of each strategy over the long run, we have also observed that the effectiveness of each strategy varies through changing economic and financial market conditions. The following chart shows the performance ranking of the ten strategies each year over the last ten years.
You can see how the strategies take turns leading and lagging. For example, after the late 1990s, many observers gave up on valuation investing as it had not performed well. In a rebound from 2001 through 2006, however, it was the number one performing strategy four of those six years. Valuation did not perform as well from 2009 through 2013. Another example of this is Future Growth. After being a highly rewarding strategy in the late 1990s, Future Growth was a poor performing strategy from 2001 through 2008, remaining, for the most part, in the bottom half of the strategies. Then from 2009 through 2015, it was best performing strategy four times and third best performing strategy twice. We believe that, through time, strategies take turns leading and lagging as economic and market conditions change. Some strategies perform well in certain conditions while others do not. Managers obviously don’t go through time alternating between getting smart and then getting stupid. We believe their relative performance fluctuates because managers stick to their strategy but the effectiveness of strategies changes through time based on market and economic conditions. Assuming an investor is unable to repeatedly guess which strategies will perform each year, we believe a blend of strategies could help buffer a portfolio from extreme performance swings through changing market and economic conditions.

Have you ever hired a manager or picked a mutual fund with an impressive three year performance record only to be disappointed with performance over the next one or two years? Although popular, we believe the 3-year performance number is a somewhat useless bit of data for predicting future performance, perhaps due to the rotation of strategy effectiveness through time. In our view, the manager with good 3-year numbers may have had three good years because his strategy was in favor (very effective) during those three years. However, we argue, as market and economic conditions change, his strategy may not be suited to handle the new conditions. We don’t believe the manager got lazy or stupid all of a sudden. His strategy just did not work as well in the new economic and market conditions. Many studies have concluded that investors may trade mutual funds too much, resulting in high turnover and poor performance. Without knowing it, they have been “hot strategy chasers,” buying into a fund after its strategy has been hot, then dumping it after it cools off, only to chase a fund pursuing a recently hot strategy.
Popularity of Funds by Strategy
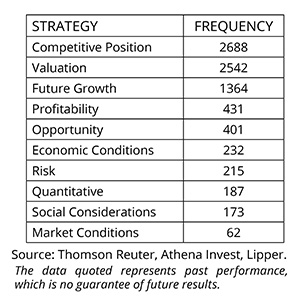 How popular is each strategy? The next chart shows the number of managers pursuing each strategy out of the 8295 (includes all share classes) mutual funds categorized by AthenaInvest. Competitive position, valuation and future growth are the most popular by far. Then the numbers begin to drop off. Only 2.7 percent of the more than seven thousand managers in the AthenaInvest system are categorized as economic conditions — managers who make decisions based on the economy. The other strategies do not care about the economy, they simply go through time looking for bargains, or well managed companies, or profitable companies or whatever elements their strategy favors.
The distribution is fairly sensible given the history of performance back to 1980. The four worst performing strategies are four of the five smallest categories.
Strategy vs. Boxes
Generally, in a good classification system, there should be high correlation within categories (i.e. those grouped together should have some commonality) and there should be low correlation between categories (i.e. each category is really different from the others). We believe style boxes do not meet these requirements of a good classification system. In fact, we have found almost the opposite, with style boxes having low correlation within boxes and high correlation between boxes. From our review of data, we believe classifying funds by style boxes may actually be worse than classifying funds randomly. In contrast to the style boxes, we have found that when classifying funds by strategies there is higher correlation within each strategy (reflecting commonality) and lower correlation between each strategy (reflecting differences) relative to the correlation data within and between style box categories. What this means is that funds in, let’s say, small value may have a lot in common with those in large growth and while all those in small value may not have much in common with each other. Whereas competitive position managers have some commonality, as they are pursuing a similar strategy, but they are very different from opportunity managers, who are pursuing a very different strategy.
One other interesting point that is worth mentioning here is that we believe diversifying among style boxes provides no better risk reduction than random selection or even assembling a portfolio of funds all from the same style box. In contrast, we feel that combining strategies provides diversification benefits because the various strategies experience different performance patterns.
Summary
Categorizing managers by strategy reveals a great deal. It shows the long term effectiveness of each strategy. It shows how the various strategies handle changing economic and market conditions. It provides a method for assembling portfolios by diversifying among the better performing strategies. Our next paper will address the topic of selecting the best, strategy consistent managers within each strategy.
In conclusion, we believe:
- Categorizing managers by strategy is useful and meaningful.
- Strategy popularity aligns with strategy performance.
- Strategy categorization may be more useful and meaningful than style boxes; and combining strategies may provide diversification benefits.

Dr. Craig Callahan is the Founder and President of ICON, and is chairman of the ICON Investment Committee. He is also Portfolio Manager for the ICON Fund and the ICON Opportunites and Long/Short Funds and Co-Portfolio Manager of the ICON Risk-Managed Balance Fund.
Past performance does not guarantee future results.
Opinions and forecasts regarding sectors, industries, companies, countries and/or themes, and portfolio composition and holdings, are all subject to change at any time, based on market and other conditions, and should not be construed as a recommendation of any specific security, industry, or sector.
Strategy Based Investing involves risks and uncertainties and does not guarantee better performance or lower costs than other investment methodologies.
Investing in securities involves inherent risks, including the risk that you can lose the value of your investment. An investment concentrated in sectors and industries may involve greater risk and volatility than a more diversified investment. Investments in international securities may entail unique risks, including political, market, regulatory and currency risks. In general, there is less governmental supervision of foreign stock exchanges and securities brokers and issuers.
Please visit ICON online at www.InvestwithICON.com or call 1-800-828-4881 for the most recent copy of ICON’s Form ADV, Part 2.

