ESG INVESTING:
Sector, Industry & Stock Impact on ESG Investing
Craig Callahan, DBA
March 8, 2019
In this article, we show returns for portfolios comprised of high-ESG scoring companies. More importantly, we use attribution analysis to show contributions from sector, industry, and stock selection within these portfolios. As Sustainalytics only has ESG ratings back to February 2014, this study covers a relatively short time period, but nevertheless we believe that it reveals some important aspects of the relationship among sectors, industries and ESG investing performance.
Investing responsibly has had varying definitions, uses, and performance throughout time. It has been defined in multiple ways; for example “green”, religious consider-ations, anti-tobacco, anti-guns, impact investing, and more. We believe that for the most part socially responsible investing (SRI) began with investors avoiding stocks of companies with products, services or behaviors found undesirable for some person-al reason. Today, there are still multiple ways to parse socially responsible investing, but the investing community is coming closer to defining the entire area to make corporate responsibility more comparable. One such way to classify companies is known as ESG scoring, wherein good behaviors are rewarded by rating companies on Environmental, Social, and Governance (ESG) issues. Sustainalytics1, a global leader in ESG and corporate governance, rates companies in those three areas and determines a company’s one composite ESG score. Rather than simply avoiding companies with undesirable behaviors, ESG rewards companies for good behaviors.
It is one thing for an individual investor to favor high-scoring ESG companies and to avoid low-scoring companies, but it is something else for a pension plan, as a fiduciary, under ERISA and the prudent man rule. The manager of a pension plan cannot impose his or her social or political views at the expense of performance. Proponents of ESG investing have argued that there is no sacrifice of returns; not because high-ESG companies can grow earnings faster or have some foundation for higher returns, but because of risk reduction. It is argued that high-scoring ESG companies are less likely to face negative events or scandals that hurt stock returns, such as sexual discrimination or harassment lawsuits, EPA investigations, or share-holder revolts.
Returns
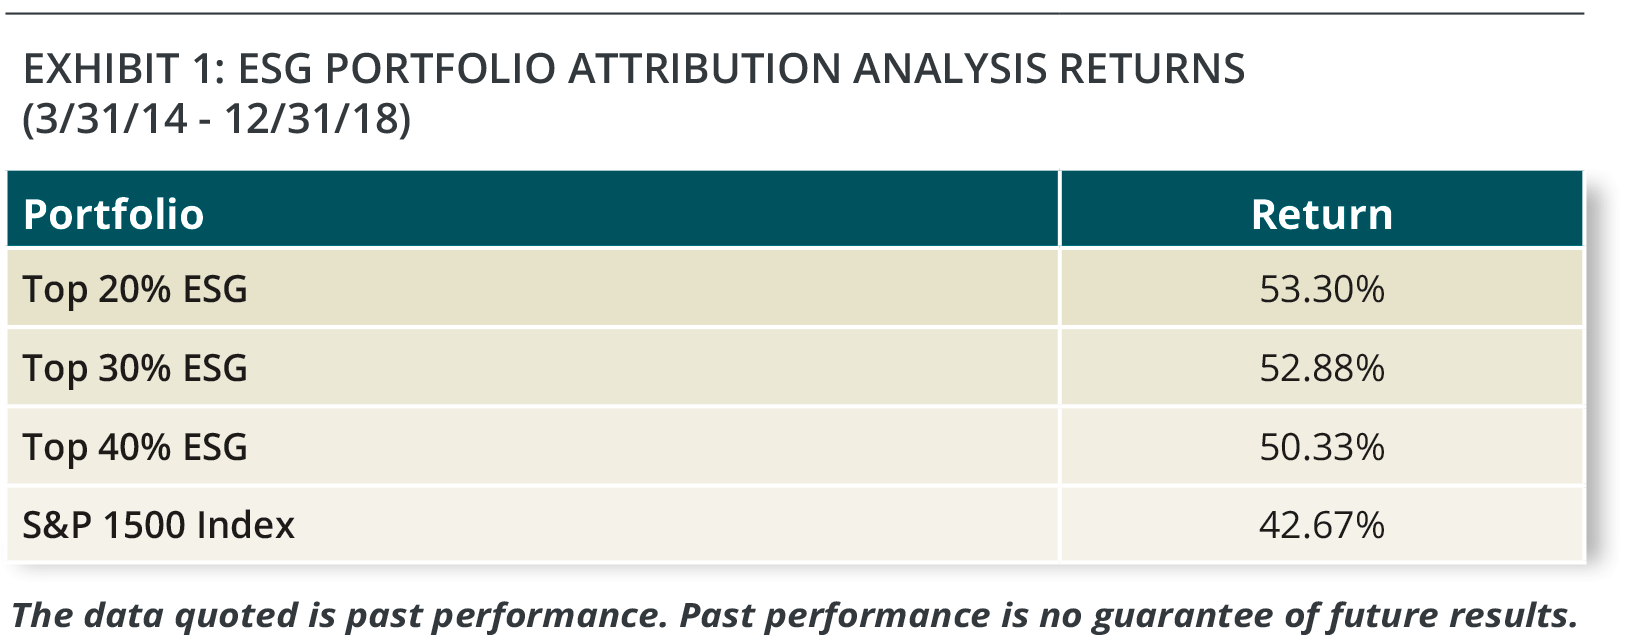
At the beginning of each quarter, we put the highest 40% ESG stocks within the S&P 1500 Index into an equal-weighted portfolio, so over the four and three-quarter year period there would be some turnover quarterly when companies dropped out or entered the top 40%. We also did this same process for companies in the top 30% and top 20%. The top 40% portfolio returned 50.33%, beating the S&P 1500 In-dex, which gained 42.67%. Raising the ESG threshold to the top 30% increased the return to 52.88%. The increased standard of top 20% ESG performed only slightly better at 53.30%. Over that limited time period it appears higher ESG standards produced higher returns, but it levels off at about the top 30%.
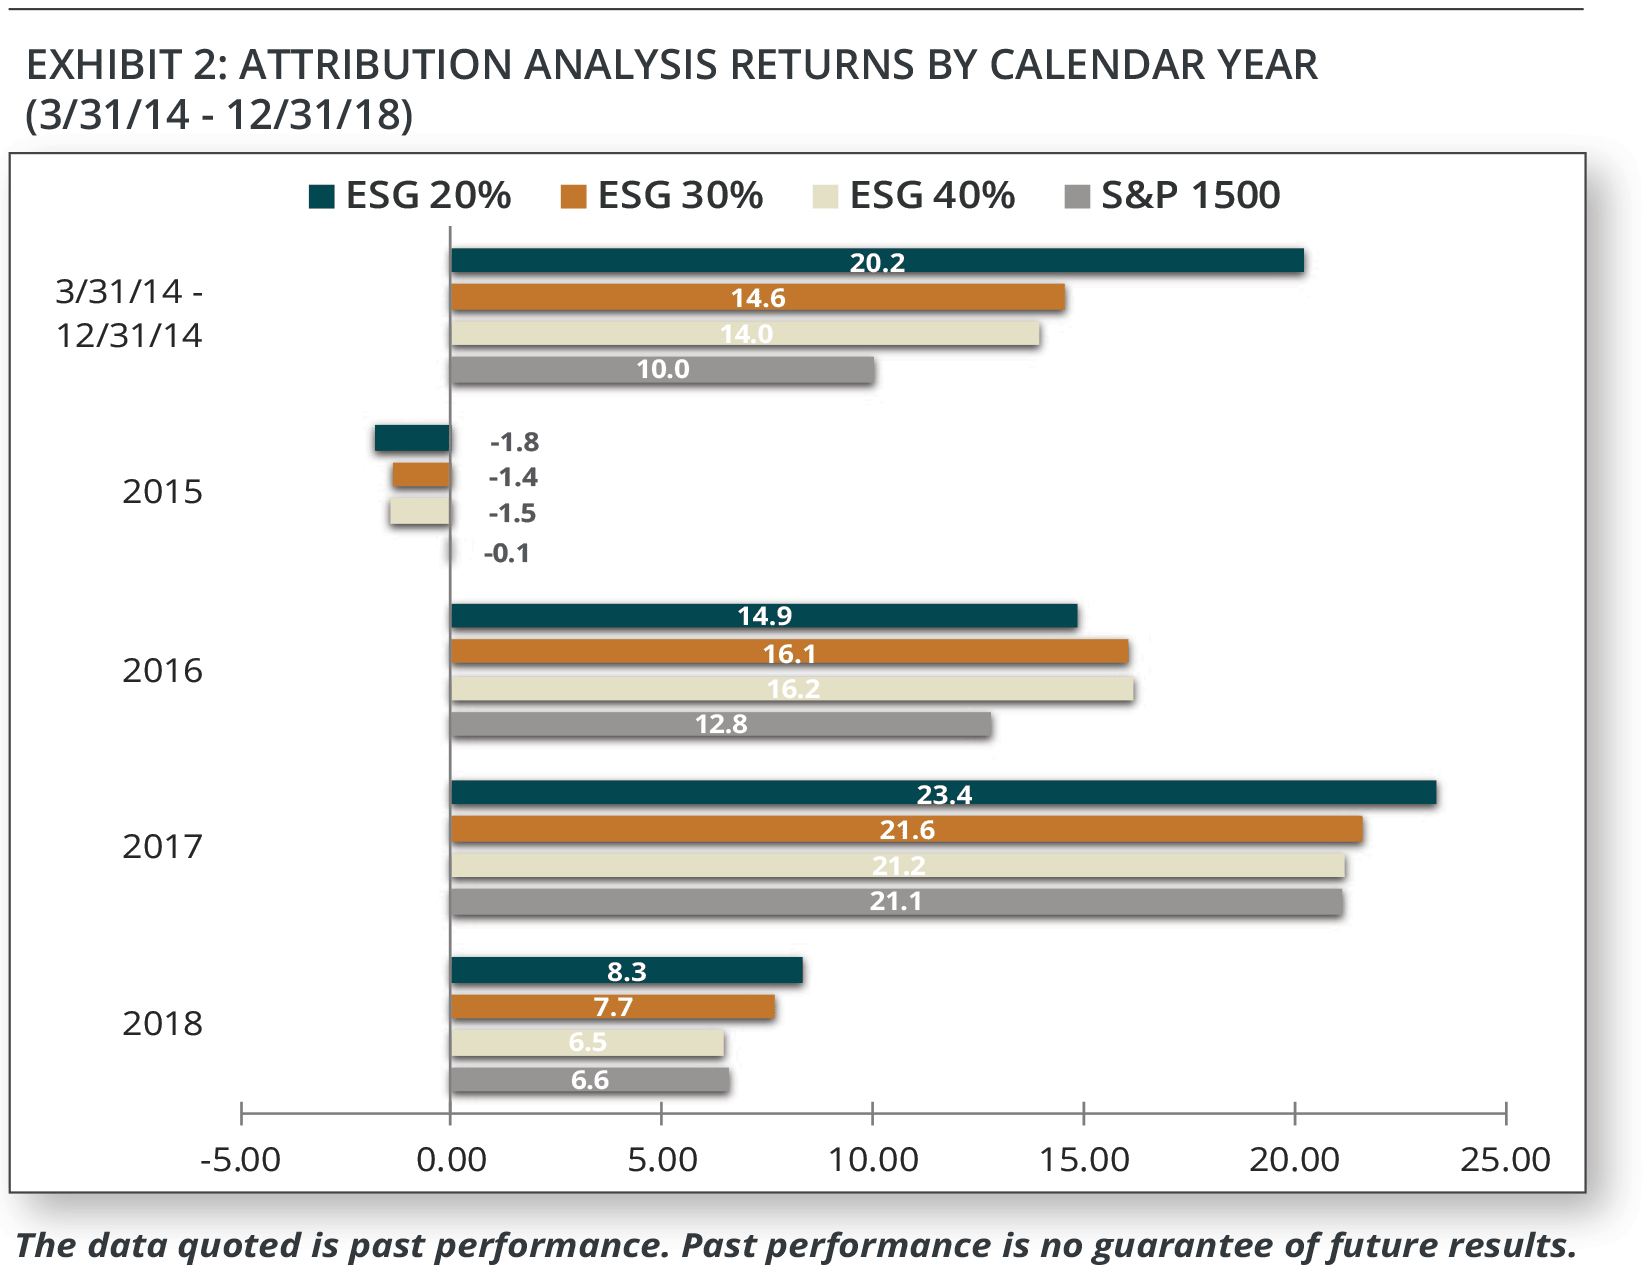
The following bar chart (Exhibit 2) shows the returns for the three ESG portfolios and the S&P 1500 Index for each calendar year of the data. It can be seen that although the high-ESG portfolios beat the index over the long run, the annual returns were not steady. For example, 2015 was a difficult year for the ESG portfolios, as they underperformed the S&P 1500 Index.
Sectors
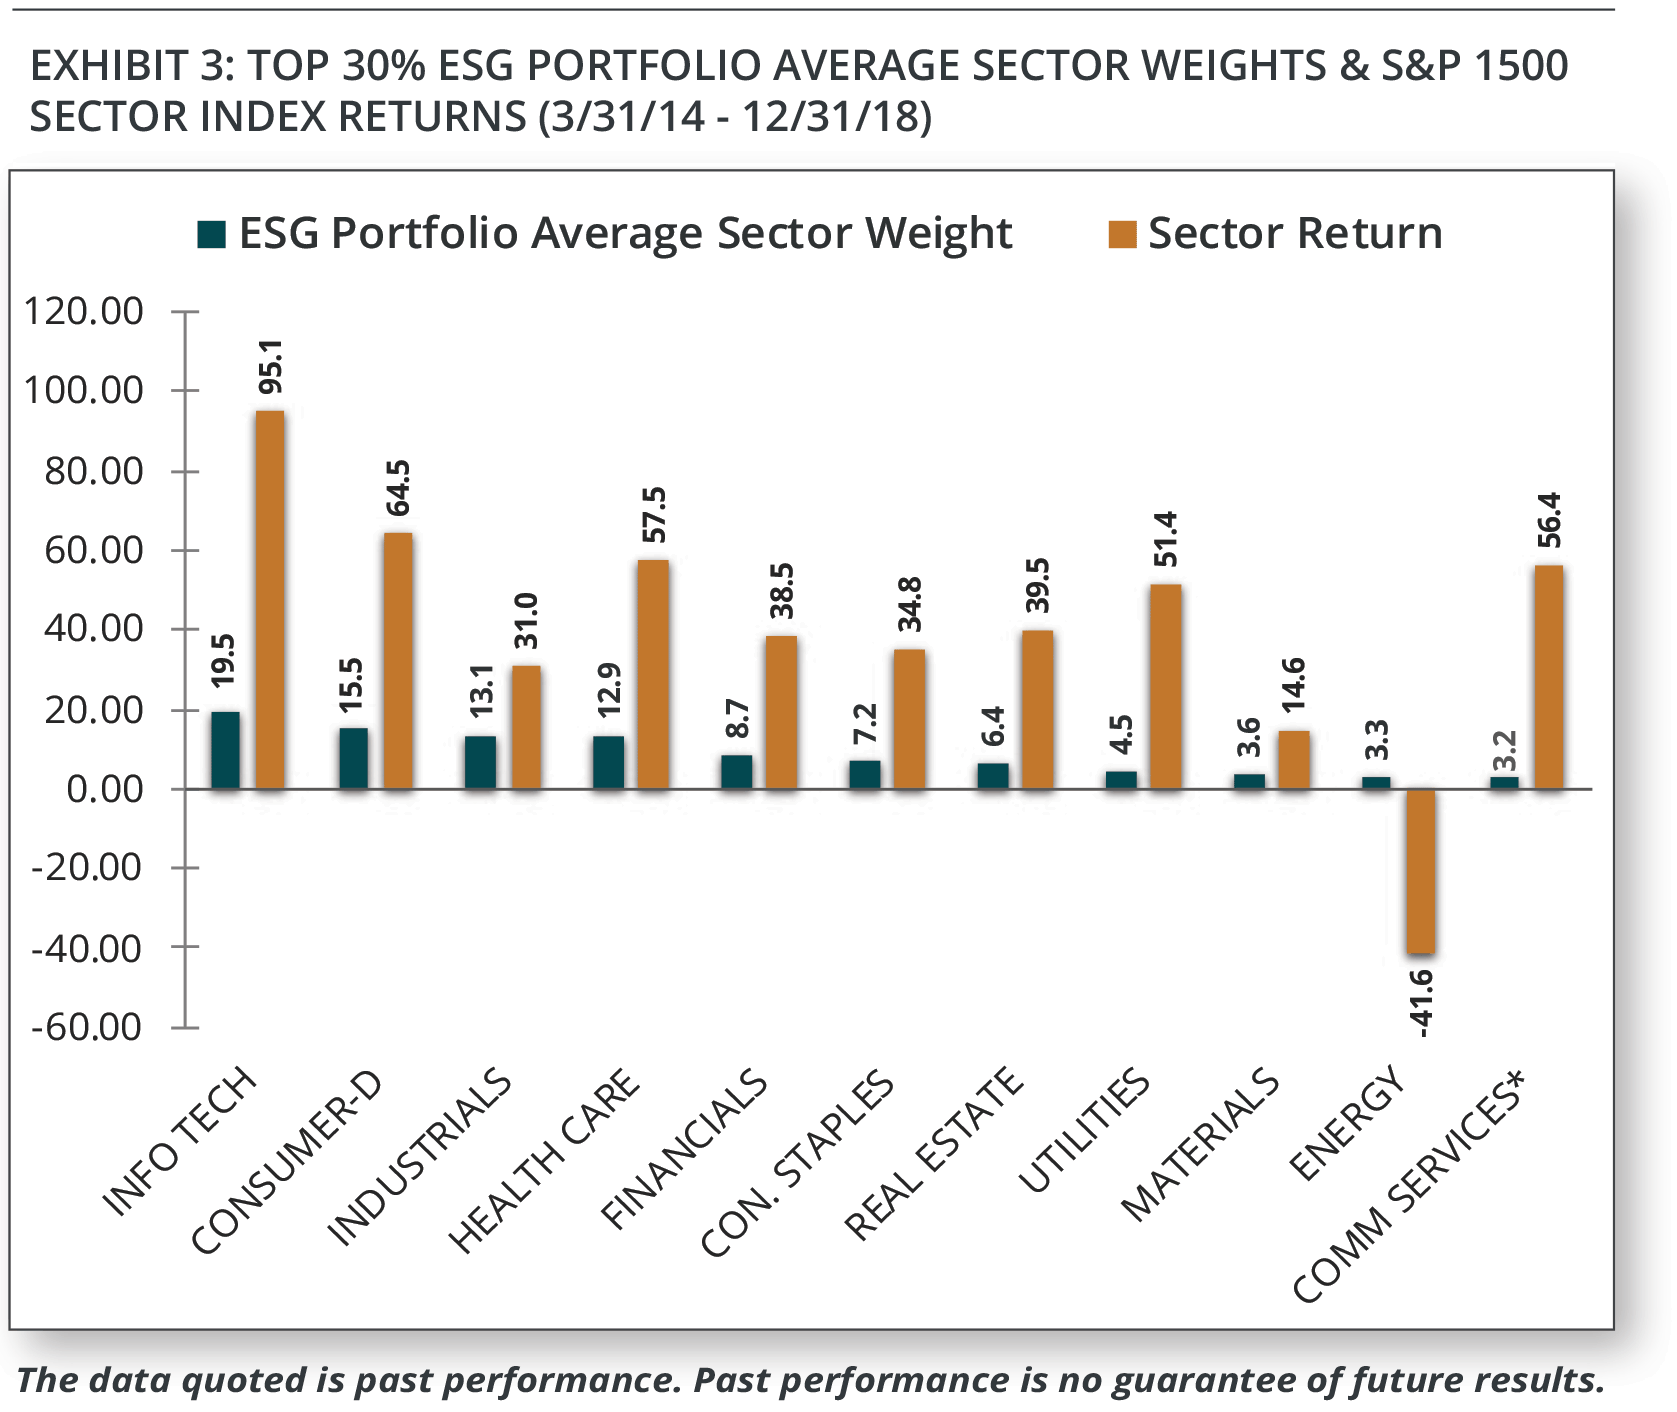
Using the S&P Global Industry Classification System (GICS), the chart shows the average sector weighting in the top 30% ESG portfolio and the cumulative sector return for the 11 S&P 1500 sector indexes. It can be seen that three of the four largest-weighted sectors (on the left) had the highest returns and two of the three lowest-weighted sectors had the lowest returns, suggesting sector weights contributed to the superior performance. The Top 30% ESG portfolio beat the S&P 1500 Index by 10.21 percentage points. 8.07 of those percentage points were attributed to sector selection, while 2.14 were attributed to stock selection. Therefore, sector selection contributed about 80% of the superior performance.
This study occurred during an economic expansion and a bull market, during which the tilt toward economically-sensitive, cyclical sectors such as Information Technology and Consumer Discretionary proved beneficial, as did the tilt away from so-called recession-proof, defensive sectors such as the former Telecommunication Services* sector and Consumer Staples. Favoring Financials over Energy also boosted performance, as the price of oil dropped sharply at first and then partially recovered over this time period. We believe markets have themes and have observed that sector performance varies year to year. The primary way for the sector weights in the ESG portfolio to change through time is for companies from different sectors to move up in ESG ratings and become included or to move down and be dropped out. Given the short time period of this study, it is too early to tell if there is proactive sector rotation in ESG ratings. For example, will companies in defensive sectors such as Utilities and Consumer Staples improve their ESG ratings and, therefore, become a larger weighting in the portfolio? Or, can the commodity-related sectors like Mate-rials and Energy improve their ratings before they become market leaders in some different economic setting? In this study we saw some sector stability and some shifting. Information Technology and Telecommunication Services/Communication Services* never deviated in being the largest and smallest sectors, respectively. On the other hand, Health Care and Industrials traded places a few times as being either third or fourth-largest. Also Materials and Utilities flipped relative positions frequently. As it is early in understanding ESG sector behavior, a manager may need to be aware of an ESG portfolio’s sector weights and perhaps consider an active sector overlay.
*On September 30, 2018, the Telecommunications Services sector was renamed and reconstituted as the Communication Services Sector.
Stock Selection
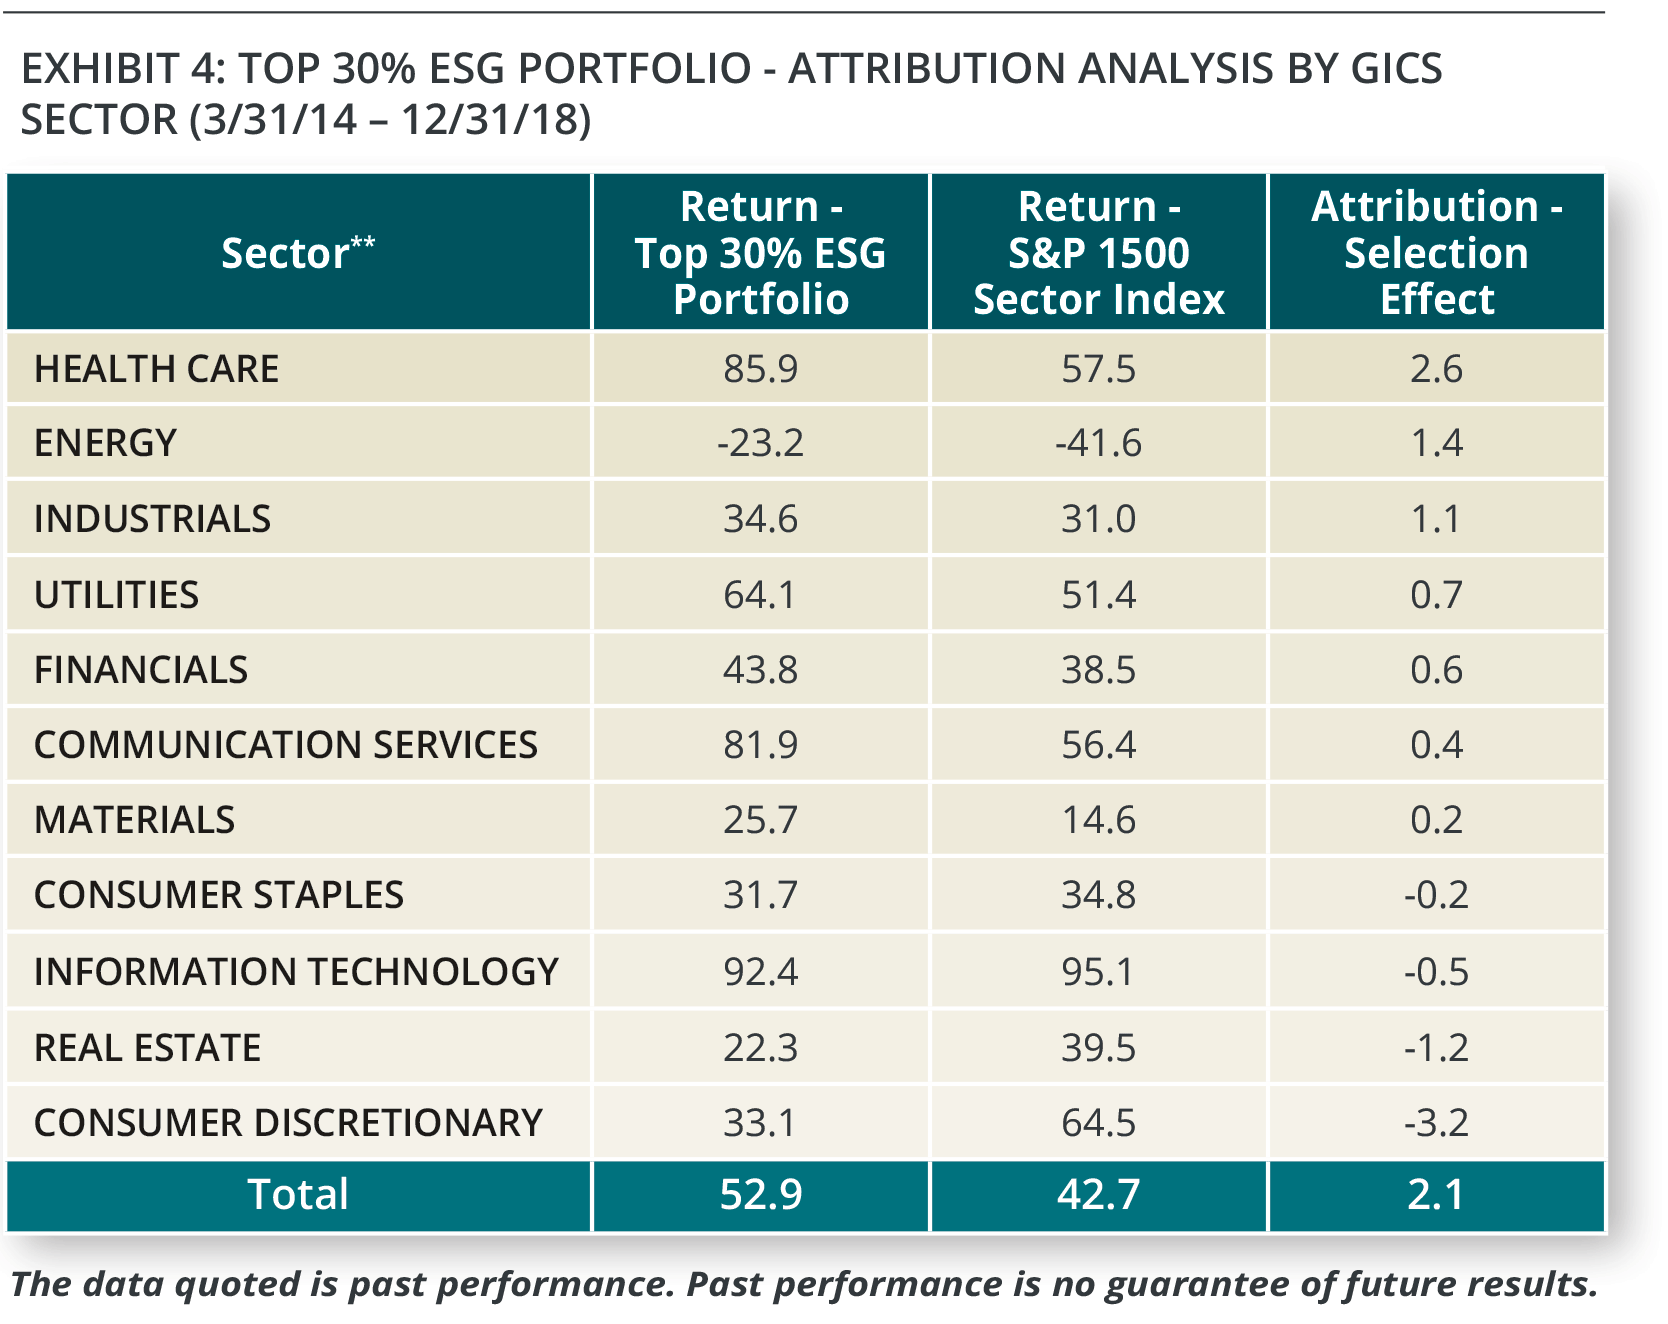
Attribution analysis computes the rate of return on the individual stocks held in a portfolio and compares that to the return for a given index. The table shows the over- or under-performance of stock selection by sector within the ESG portfolio to the S&P 1500 sector indexes over the four and three-quarter year period. It shows that, on average, ESG stock selection contributed positively to performance, but this varied by sector. Higher-ESG rating provided positive stock selection in the Health Care, Industrials, Materials, Financials, Utilities, Energy and Communication Services* sectors. Higher-ESG rating was not beneficial in the Consumer Discretionary, Real Estate, Consumer Staples and Information Technology sectors. .
*On September 30, 2018, the Telecommunications Services sector was renamed and reconstituted as the Communication Services Sector.
** Excludes unassigned securities.
Industries
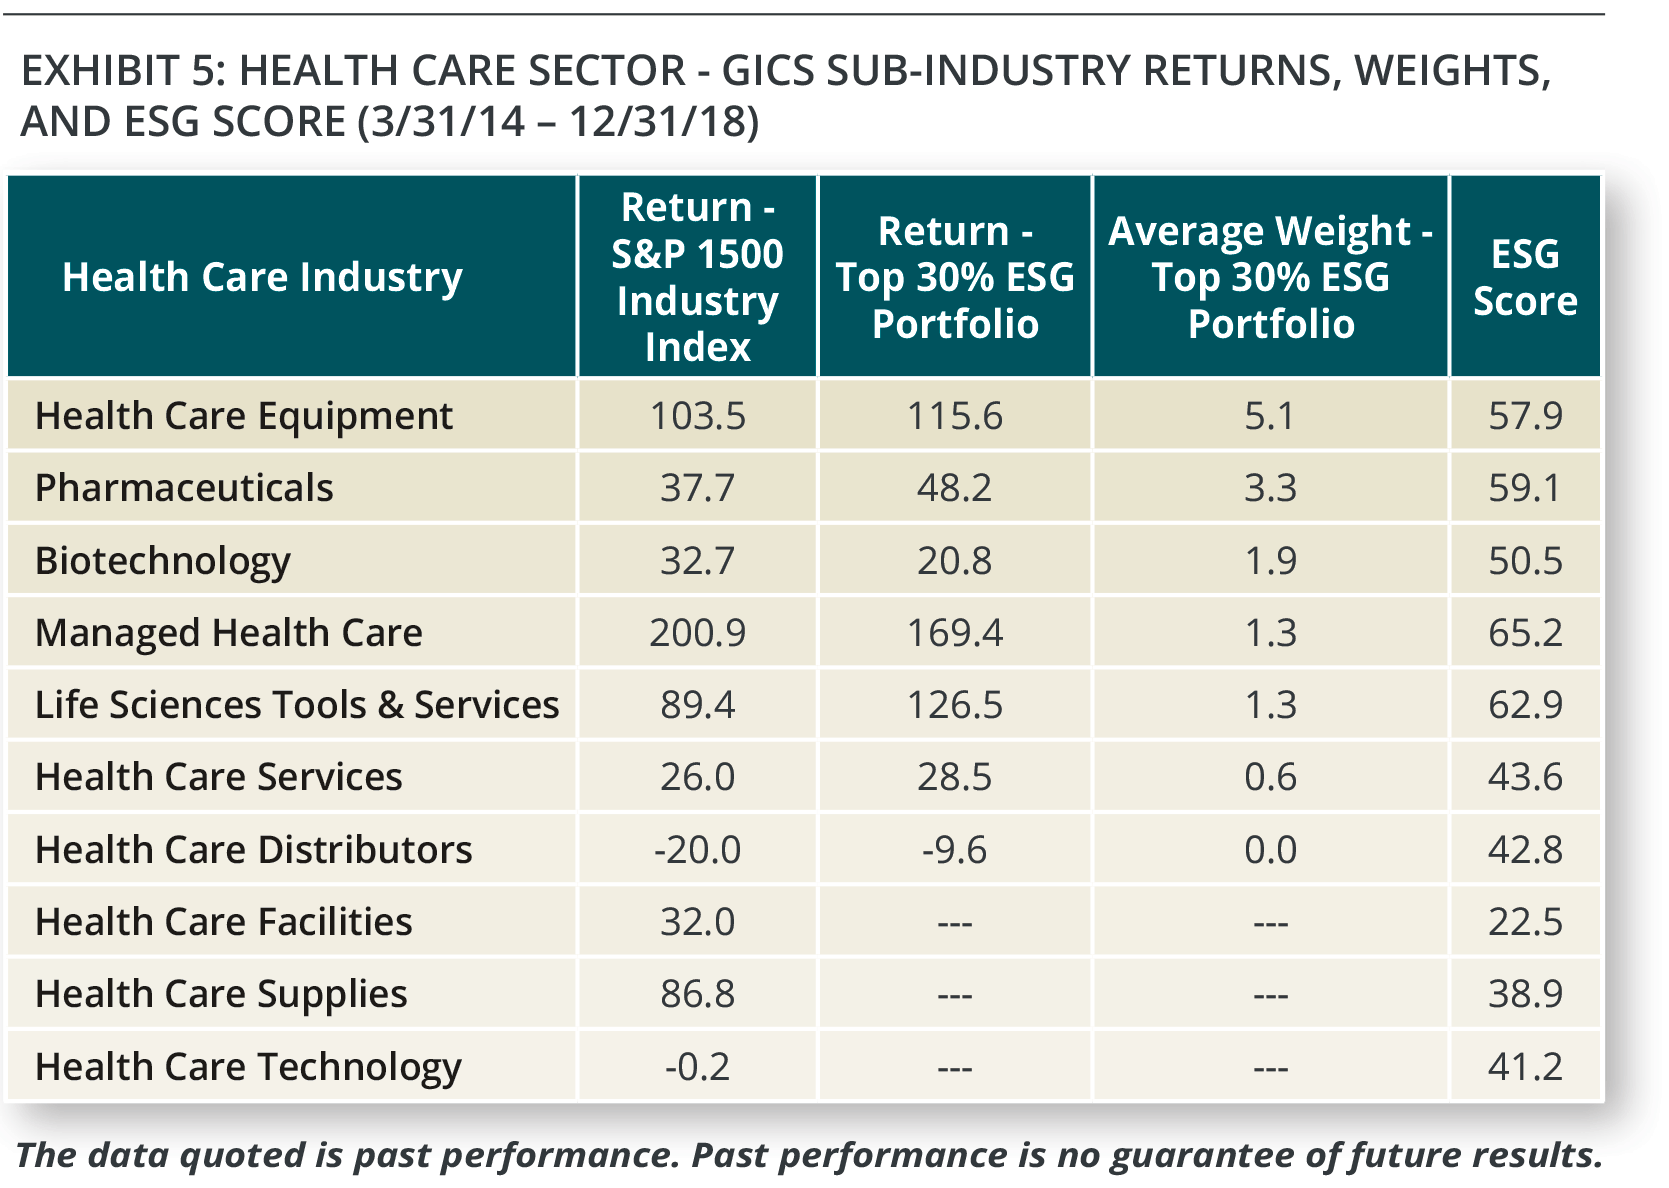
GICS has 11 sectors and 158 sub-industries. For example, there are 29 sub-industries in the Consumer Discretionary sector, in which the top 30% ESG portfolio had the poorest stock selection. In the Health Care sector, where the top 30% ESG portfolio had the best stock selection, there are 10 sub-industries. The table below shows the sub-industries for Health Care ranked by their average weights in the ESG portfolio over the four and three-quarter year time period. The far right column shows the average Sustainalytics ESG score for the companies in the industry. The industries’ weights in the portfolio roughly align with the industry ESG score. The five industries with the largest weights have higher ESG scores, between 50 and 65. The five industries with either minimal or no exposure have lower ESG scores, between 22 and 43. The first column is the return for the S&P 1500 industry index. It reveals the ESG portfolio had little or no exposure to the three worst-performing industries and had significant exposure to three of the four best-performing industries. The next column shows the return for the stocks held in the Top 30% ESG portfolio. It shows that for five of the seven industries held, the portfolio stocks beat the index and two of the seven lagged. Industry selection helped in Health Care, and while Consumer Discretionary was the worst-contributing sector in the ESG Portfolio, industry selection actually helped Consumer Discretionary performance. As we do not see year to year industry rotation within the ESG portfolio, but instead expect industry tilts are a long-term bias, a manager of an ESG portfolio should be aware of, and perhaps adjust, the industry selection.
Industry Bias?
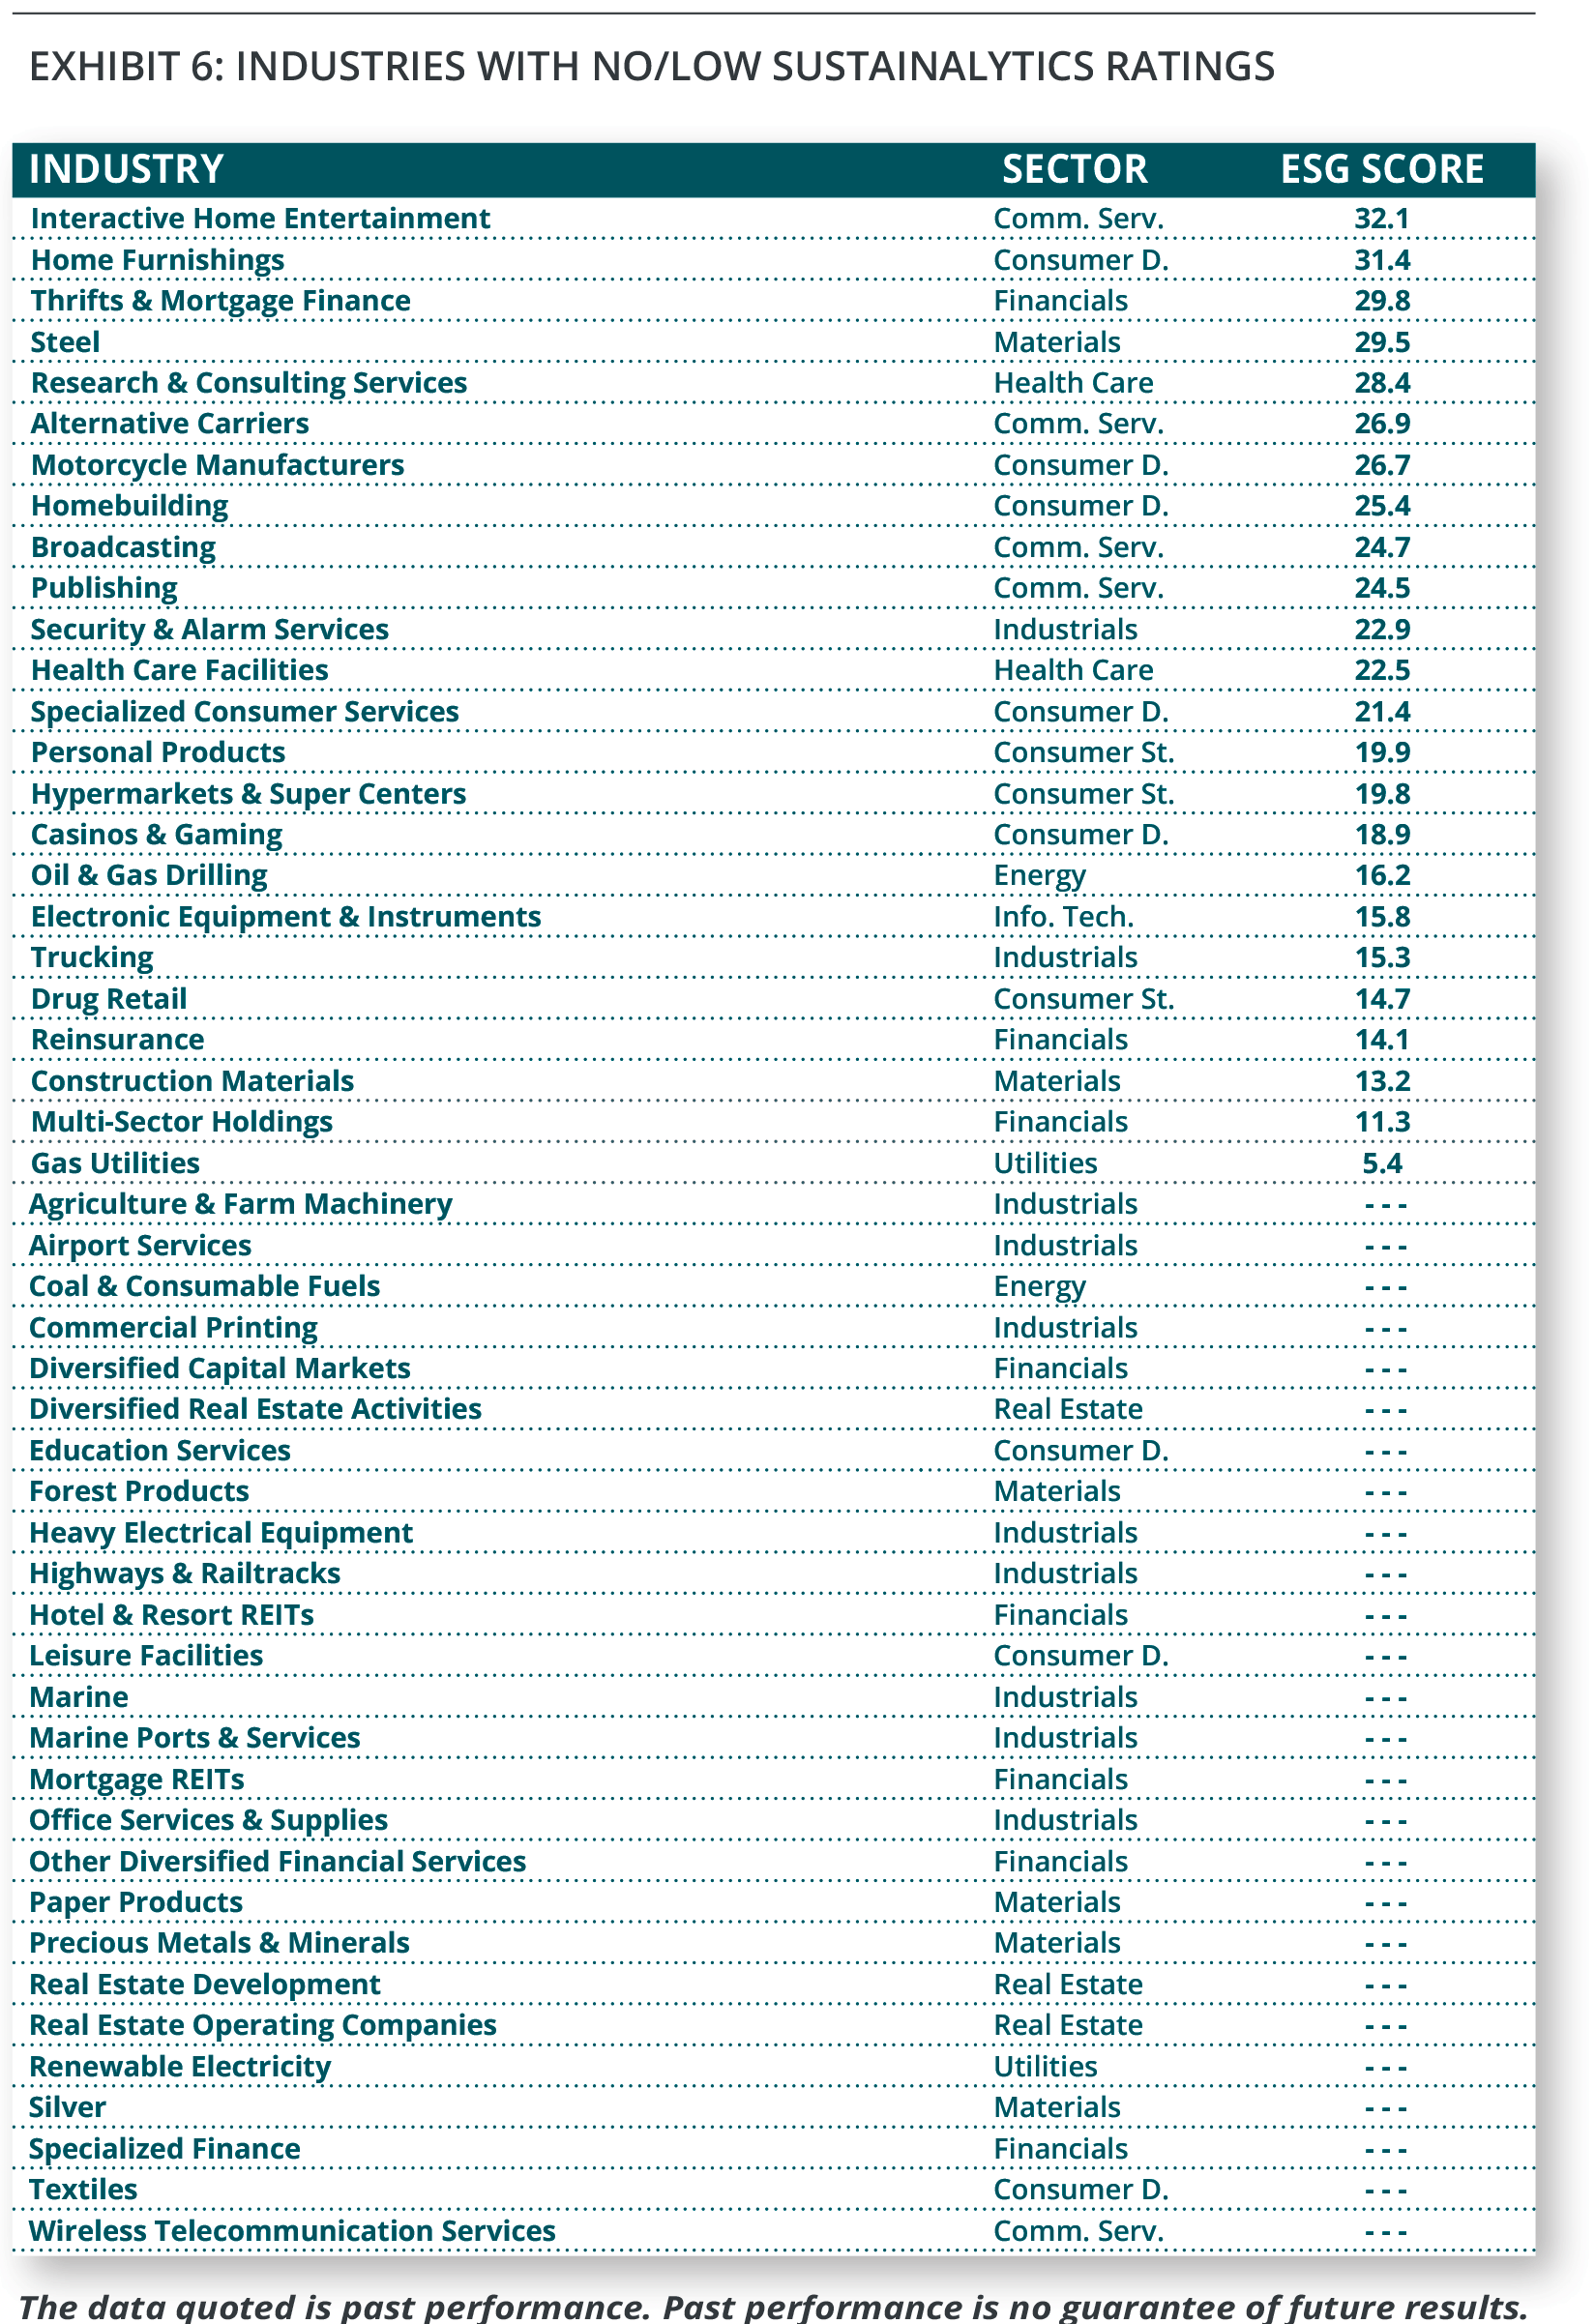
Of the 158 sub-industries, only about 100 found their way into the Portfolio comprised of the top 30% of ESG scored companies over the four and three-quarter years. The table first shows the lowest-scoring 24 industries and presumably industries unlikely to be included in an ESG portfolio. Below those in the table are the S&P 1500 industries that do not have companies rated by Sustainalytics, therefore rendering those industries ineligible for inclusion in an ESG portfolio), thus showing there are many industries that were either ineligible or unlikely to be included in an ESG portfolio for this study.
Conclusion
Portfolios selecting stocks based on top 40%, top 30% and top 20% ESG scores beat the S&P 1500 Index from March 31, 2014 through December 31, 2018, suggesting ESG factors may contribute positively to performance. However, we observed that the portfolios’ performance was aided by sector and industry tilts that appear to be a bias of the ESG rating system, as those tilts did not vary much year to year. Because of this, as sector and industry themes vary through time, a manager using ESG as a selection criteria should be aware of, and perhaps manage, sector and industry weights within a portfolio.

Dr. Craig Callahan is the Founder and President of ICON, and is chairman of the ICON Investment Committee. He is also Portfolio Manager for the ICON Fund and the ICON Opportunites and Long/Short Funds and Co-Portfolio Manager of the ICON Risk-Managed Balanced Fund.
Important Information
The data quoted is past performance. Past performance is no guarantee of future results.
1Copyright © 2019 Sustainalytics. Sustainalytics is a global leader in ESG and Corporate Governance research and ratings. ICON Advisers, Inc. subscribes to Bloomberg and FactSet services that license Sustainalytics ESG scores and uses that data for research purposes. ICON Advisers, Inc., and Sustainalytics are not affiliated.
Opinions and forecasts regarding sectors, industries, companies, countries and/or themes, and portfolio composition and holdings, are all subject to change at any time, based on market and other conditions, and should not be construed as a recommendation of any specific security, industry, or sector.
Investing in securities involves inherent risks, including the risk that you can lose the value of your investment. An investment concentrated in sectors and industries may involve greater risk and volatility than a more diversified investment.
ICON’s value-based investing model is an analytical, quantitative approach to investing that employs various factors, including project-ed earnings growth estimates and bond yields, in an effort to determine whether securities are over- or underpriced relative to ICON’s estimates of their intrinsic value. ICON’s value approach involves forward-looking statements and assumptions based on judgments and projections that are neither predictive nor guarantees of future results. Value readings are contingent on several variables including, with-out limitation, earnings, growth estimates, interest rates and overall market conditions. Although valuation readings serve as guidelines for our investment decisions, we retain the discretion to buy and sell securities that fall beyond these guidelines as needed. Value invest-ing involves risks and uncertainties and does not guarantee better performance or lower costs than other investment methodologies.
The unmanaged Standard & Poor’s Composite 1500 (S&P 1500) Index is a broad-based capitalization-weighted index comprising 1,500 stocks of Large-cap, Mid-cap, and Small-cap U.S. companies. The unmanaged Standard & Poor’s (S&P) Composite 1500 Sector Indexes track the performance of sectors that comprise the S&P Composite 1500 Index. The unmanaged Standard & Poor’s (S&P) Composite 1500 Industry Indexes track the performance of companies in industries that comprise the S&P Composite 1500 Index. Total return for the unmanaged indexes include the reinvestment of dividends and capital gain distributions but do not reflect deductions for commissions, management fees, and expenses. The Portfolios’ composition may differ significantly from the indexes. Individuals cannot invest directly in an index.
Data Sources: FactSet, Bloomberg, Sustainalytics.
Please visit ICON online at www.iconadvisers.com or call 1-800-828-4881 for the most recent copy of ICON’s Form ADV, Part 2.
© 2019 ICON AdvisersSM All Rights Reserved.

