Deficiencies of P/E in Predicting Returns
Dr. Craig Callahan, DBA – ICON Founder & President
March 7, 2017
“We suspect the slope of the linear regression line is not as steep as those who use P/E to attempt to predict future returns believe.”
Throughout the nearly eight-year stock market advance from the recession low of March 2009 through the record highs of March 2017, we have seen some analysts caution investors with regard to owning stocks. Some of these analysts cite the price to earnings (P/E) ratio for various indexes such as the S&P 500 Index and try to make the case that a lofty P/E, and therefore apparently expensive stock prices, could predict lower stock prices from that time forward. With many indexes hitting record highs in March 2017, more and more of those cautious warnings have appeared in the media and advisory services. But, not so fast!
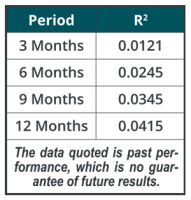 While the notion that lower stock prices should follow expensive stock prices and that higher stock prices should follow cheap stock prices is intuitively appealing, it is not supported by statistics, at least not when using P/E as a measure of value. To illustrate this point, we took the end-of-month P/E ratio for the S&P 500 Index for close to 50 years, from January 1967 through November 2016 and computed simple price change rates of return for three, six, nine and twelve months later for all rolling periods through November 2016. The table, at right, shows the R-squared (correlation coefficient), for P/E and subsequent returns for the four different time periods.
An R-square of zero means the relationship between P/E and subsequent returns of the S&P 500 is random, or no relationship. An R-square value of 1 would mean P/E and subsequent returns of the S&P 500 are perfectly correlated. The first thing that stands out from our computations is that with such low correlations close to zero, P/E may not be good at predicting future returns for the S&P 500. While the correlation does increase slightly from 3-month periods to 12-month periods, even at 12-months , about 95.4% of the returns on the S&P 500 are explained by something other than P/E. In other words, P/E only explains 4.56% of the next year’s returns.
The scattergram below provides a visual of the random relationship between P/E and future returns. P/E for the S&P 500 is on the horizontal axis and subsequent 12-month price returns are on the vertical axis. Looking at the chart, there are plenty of months when the S&P 500 had a low P/E but the return over the next twelve months was negative and/or below average. Also, notice there were plenty of months with high P/E ratios that were followed by above average returns over the next twelve months. The slightly downward sloping line is the linear regression, or best fit, line. The fact that it is downward sloping suggests that what minimal relationship there is between P/E and subsequent 12-month returns is negative. Higher P/Es are associated with slightly lower subsequent returns than lower P/E ratios, but in statistical terms the relationship is extremely weak.
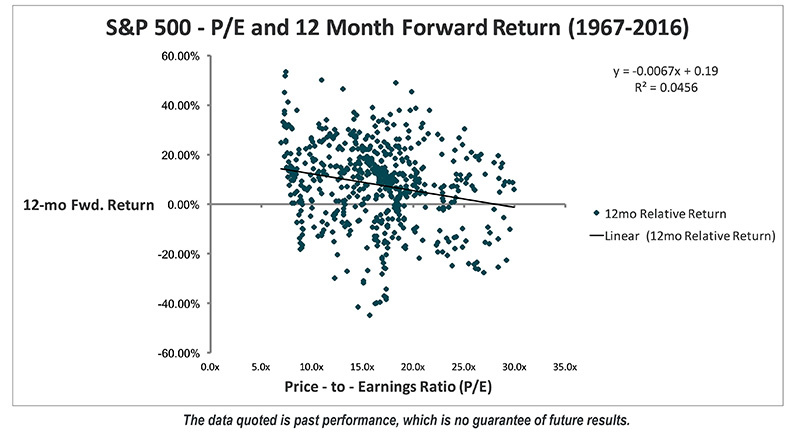
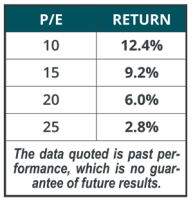 We suspect the slope of the linear regression line is not as steep as those who use P/E to attempt to predict future returns believe. The regression equation is Rm = .19 – .0067 x P/E, where Rm is the return on the S&P 500 (“the market”) and -.0067 is the slope coefficient which is multiplied times the P/E. The table below computes the expected rate of return for the subsequent year for four different P/E ratios. Over this 50 year period, a P/E of 10 has been followed by an average return of 12.3%, whereas a P/E of 25 has been followed by an average return of 2.3%.
We suspect that analysts using P/E to recommend selling stocks when the P/E ratio is high, would expect the difference between returns following P/E ratios of 10 and 25 to be much greater.
What’s wrong? Is it the concept that stocks should be expensive at peaks and cheap at bottom? Or is P/E deficient at measuring value? We submit P/E is deficient. Finance textbooks are uniform in teaching how to calculate the value of any assets – the present value of future cash flows. Cash flows are predicted to grow and then discounted to their present value considering risk and interest rates. Declaring a P/E is too high or too low as a measure of value ignores growth, risk and interest rates.
At ICON, we compute a value-to-price (V/P) ratio for each stock in our database, which gives us a measure of our estimate of a stock’s intrinsic value. To calculate the V/P for a company, we start with average earnings and future earnings growth estimates for a company. Then we discount future earnings back to a present value considering risk and a measure of the company’s bond yield as the basis for opportunity cost. The average value-to-price (V/P) ratio for all the stocks in the ICON database gives us an indication of the overall under or over-pricing for the broad market according to our system. Based on our research, our overall average market V/P ratio has a steeper slope and higher correlation with future returns than does the simplistic P/E.
In summary, many investors have missed out on some or all of the impressive market advance from its low in March 2009 through record highs in March 2017 because of the belief that stocks were too expensive based on P/E ratios. We believe the concept that stocks are cheap at bottoms and expensive at peaks is valid. P/E is just deficient at measuring value.

Dr. Craig Callahan is the Founder and President of ICON, and is chairman of the ICON Investment Committee. He is also Portfolio Manager for the ICON Fund and the ICON Opportunities and Long/Short Funds and Co-Portfolio Manager of the ICON Risk-Managed Balance Fund.
IMPORTANT INFORMATION
The data quoted represents past performance, which is no guarantee of future results.
Opinions and forecasts regarding sectors, industries, companies, countries and/or themes, and portfolio composition and holdings, are all subject to change at any time, based on market and other conditions, and should not be construed as a recommendation of any specific security, industry, or sector.
Price/Earnings Ratio (P/E) is the price of a stock divided by its earnings per share.
In Statistics, the coefficient of determination, R-squared, is the proportion of variability in a data set that is accounted for by a statistical model. R-squared values range between 0.00 and 1.00. 0.00 indicates that the model explains none of the variability, while 1.00 indicates that the model explains all of the variability. In general, the higher the R-squared, the better the model fits the data.
Investing in securities involves inherent risks, including the risk that you can lose the value of your investment. An investment concentrated in sectors and industries may involve greater risk and volatility than a more diversified investment.
ICON’s value-based investing model is an analytical, quantitative approach to investing that employs various factors, including projected earnings growth estimates and bond yields, in an effort to determine whether securities are over- or underpriced relative to ICON’s estimates of their intrinsic value. ICON’s value approach involves forward-looking statements and assumptions based on judgments and projections that are neither predictive nor guarantees of future results. Value readings are contingent on several variables including, without limitation, earnings, growth estimates, interest rates and overall market conditions. Although valuation readings serve as guidelines for our investment decisions, we retain the discretion to buy and sell securities that fall beyond these guidelines as needed. Value investing involves risks and uncertainties and does not guarantee better performance or lower costs than other investment methodologies.
ICON’s value-to-price ratio is a ratio of the intrinsic value, as calculated using ICON’s proprietary valuation methodology, of a broad range of domestic and international securities within ICON’s system as compared to the current market price of those securities. According to our methodology, a V/P reading of 1.00 indicates stocks are priced at intrinsic value. We believe stocks with a V/P reading below 1.00 are overvalued while stocks with a V/P reading above 1.00 are undervalued. For example, we interpret a V/P reading of 1.15 to mean that for every $1.00 of market value, there is $1.15 of intrinsic value which has not yet been realized in the market price.
The unmanaged Standard & Poor’s (S&P) 500 Index is a market value-weighted index of large-cap common stocks considered representative of the broad market. Total return for the unmanaged index includes the reinvestment of dividends and capital gain distributions but do not reflect deductions for commissions, management fees, and expenses. Individuals cannot invest directly in an index.
Source: Bloomberg, FactSet
Please visit ICON online at www.InvestwithICON.com or call 1-800-828-4881 for the most recent copy of ICON’S FORM ADV, Part 2.

